In the aftermath of the launch of the new website, we present the results of the cognitive survey and some of the new features of the new Europlanning Guide.
Eurodesign Survey Results
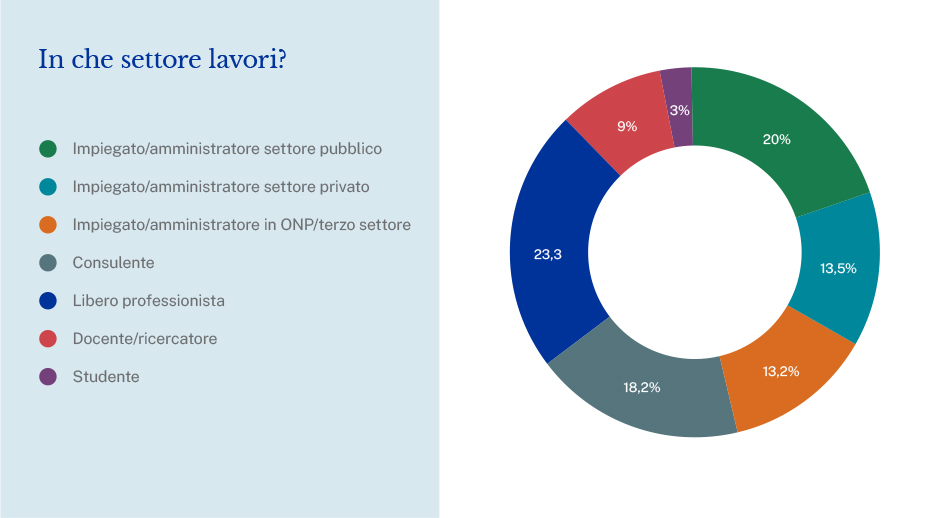
The survey shows that a large majority of users (84 percent) work in a field that has to do with European funds, programs or policies.
The origin of users is varied and well distributed between self-employed (41 percent), employees (47 percent) and teachers, researchers and students (12 percent). The public sector, private sector and third sector are similarly represented. Since the open-ended responses in the questionnaire suggest that the use of the Guide is widespread in education, it is possible that the figure for students (3 percent) is affected by a lower response rate.
In fact, these data and those that follow reflect the responses of users who provided a survey response. From them it is possible to draw some analysis about the Guide’s audience and its preferences.
Eurodesign survey: in which sector does the the user of the Guide?
A quick analysis of the responses regarding users’ professional experience and their prevalent use of the Guide allows us to identify some recurring profiles and prevalent interests among our audience:
- Officials and representatives of various public bodies, particularly municipalities, local governments and educational institutions, interested in calls for proposals to expand their institutional activities or for the benefit of youth and students;
- Professionals in the private sector, active in SMEs or start-ups, especially in the fields of entrepreneurship and business consulting, but also in more traditional professional fields (architects, engineers, lawyers, accountants, and surveyors);
- Professionals and volunteers involved in the third sector, for associations and NGOs of various kinds, especially in the social welfare, assistance, disability, immigration, arts, entertainment, culture and communication sectors;
- University, graduate and master’s course teachers (interested in learning more about europlanning and integrating it among their study materials), students and aspiring europlanners;
- Professional Europrojectors, working as freelancers or within agencies and organizations, professionals in the field of evaluation, reporting and auditing;
- Workers in the fields of environment and tourism,agriculture and natural heritage protection, green economy and circular economy.
Sectoral interests are thus well distributed and confirm the generalist approach of the Guide: we devote ourselves to a little bit of everything, but remain continuously open to specific requests from our readers.
Europrojecting Survey: How is the Guide used?
Use by users is equally varied and reflects the nature of their professional interests. Based on the feedback received, the Guide is mainly used for:
- Gain initial knowledge of the field of europlanning, launch into new professional strand (e.g., to study the subject or prepare competitions) or extend your skills in a new area functional to your business;
- Refer to information and reference sources more easily, as an aid and information tool in one’s work, or as reference material for educational and operational purposes;
- As a source of updates, insights and insights to improve one’s business, knowledge and “know how” in areas directly or indirectly related to europrojecting.
The Guide’s new platform is designed for easier reference and extended reading directly online, from the site, to take full advantage of the wealth of internal and external links and references. The new format accompanies the texts with infographics and the use of symbols, colors, and formats that make the content easier to read and enjoy. The Guide is no longer downloadable in e-pub format (found to be hostile to many users) but can be easily printed in its various sections, in hard copy or pdf format, should it serve (for example) as a training aid.
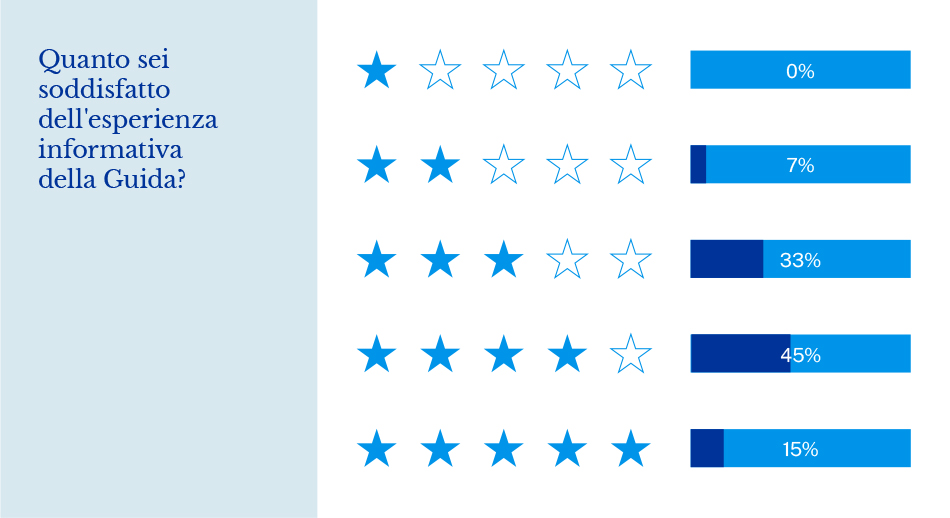
Europrojecting Survey: What is the level of satisfaction with the Guide?
Most users appreciate the clarity and comprehensiveness of the Guide, as well as its ability to touch in a simple, yet broad and sufficiently in-depth way on all the most important issues related to europlanning. Many appreciate its wealth of links, cross-references, schematics, and language. However, many claim to still know and hang out with her very little. Some users require greater clarity, simplicity and usability of approach, others more practicality and depth in analyzing certain content. We really appreciate all the comments and we are working on it!
Quantitative data regarding user satisfaction are excellent: more than 92% of users give it a positive rating (rating 3 out of 5 or higher) and more than 55% give it a very positive rating (rating 4 out of 5 or 5 out of 5). Nearly one in seven users give the Guide top marks. We hope that the new version of the Guide and the new content we will produce will meet the needs of even less convinced users.
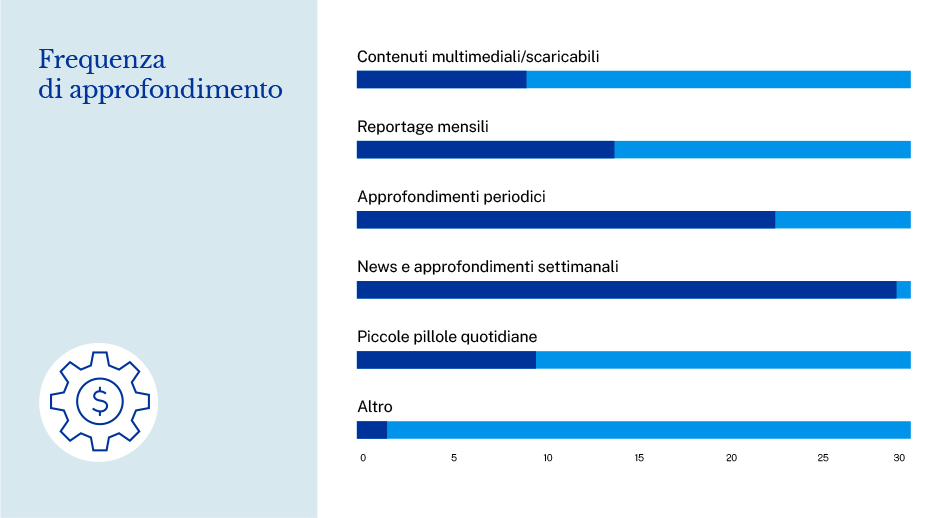
Europlanning Survey: Qhat are the in-depth topics you would like to see in the Guide?
The answer to the questions regarding users’ needs and preferences regarding the new Guide outlines a very clear path. First of all, the content categories concerning the Upcoming Calls (21 percent), the In-Depth Guides (20 percent), and New Programming 2021-2027 (19 percent). They are followed, however not too far behind, by the Europlanning experience (15%), the Questions and answers on specific aspects (10%), current events from Europe and from the territories (6% and 8% of preferences, respectively).
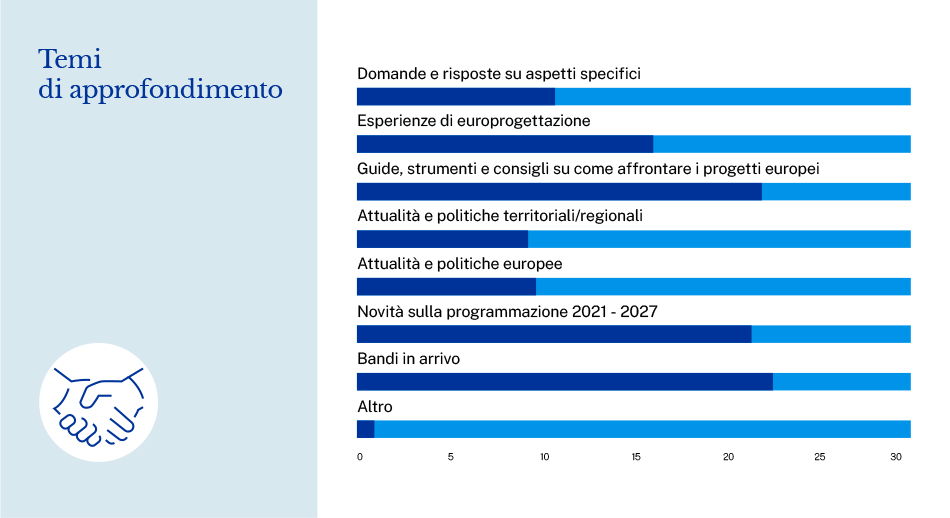
This order reflects, not surprisingly, the order of the main topics covered in recent times: we try to adapt as much as possible to the needs of the audience and to what we perceive to be of greatest interest among the available information and materials.
The trend is also very clear in terms of the form and type of insights provided. In fact, users express a clear preference for classic forms of updating(In-depth Articles/Tutorials, 29%) and some innovative forms(Webinars, Explanatory Clips and Infographics, at 23%, 18% and 17%, respectively). In addition to in-depth articles, traditionally a fundamental part of the Guide, we therefore plan to enrich the new site with a greater presence of Infographics (also relaunched on our social channels) and with a special section dedicated to videos and webinars.